The fish-lsp binary ships several built-in diagnostics. Most problems can be
identified with the commands below.
Tip
Short abbreviations for many of these commands are available — see Abbreviations.
First Checks
# every available sub-command and flagfish-lsp --help-all# build version, paths, capabilities, healthfish-lsp info# confirm the resolved binary is the one you expect, and on your $PATHfish-lsp info --binwhich fish-lsp
Startup Verification
The server ships with a built-in headless startup test, to verify that the server can perform analysis on a given workspace without requiring a working client connection.
This is useful for debugging issues with the server itself, or with your client configuration.
In general, a working output from the following command indicates that the server is functioning correctly:
❯
fish-lsp info --time-startup
show outputhide output▾
fish-lsp NOTE: a normal server instance will only start one of these workspaces if you frequently find yourself working inside a relatively large workspaces, please consider using the provided environment variable `set -gx fish_lsp_max_background_files`-----------------------------------------------------------------------------------------------Server Start Time: 796.34 msBackground Analysis Time: 1454.20 msTotal Files Indexed: 841 files-----------------------------------------------------------------------------------------------Indexed paths in `$fish_lsp_all_indexed_paths`: 2 paths [1] | `$__fish_config_dir` | 828 files [2] | `$__fish_data_dir` | 13 files-----------------------------------------------------------------------------------------------
Profiling is offered, to measure the duration of each phase in the startup process, and to help identify any bottlenecks in the server's initialization.
-----------------------------------------------------------------------------------------------Server Start Time: 776.57 msBackground Analysis Time: 1414.10 msTotal Files Indexed: 828 files-----------------------------------------------------------------------------------------------Startup Stage Profile 9 stages [1] | analyzer.analyze() | count 675 total 954.26 ms | avg 1.41 ms | max 47.16 ms [2] | analyzer.getAnalyzedDocument() | count 675 total 866.45 ms | avg 1.28 ms | max 44.59 ms [3] | analyzer.processNestedTree() | count 675 total 577.03 ms | avg 0.85 ms | max 34.62 ms [4] | analyzer.parser.parse() | count 675 total 219.26 ms | avg 0.32 ms | max 13.04 ms [5] | analyzer.symbols.refreshDocument() | count 675 total 85.09 ms | avg 0.13 ms | max 7.25 ms [6] | analyzer.createFullDocument() | count 675 total 67.82 ms | avg 0.10 ms | max 3.61 ms [7] | analyzer.cache.setDocument() | count 828 total 0.57 ms | avg 0.00 ms | max 0.04 ms [8] | analyzer.referenceCandidates.removeByUri() | count 675 total 0.56 ms | avg 0.00 ms | max 0.10 ms [9] | analyzer.analyzePartial() | count 153 total 0.25 ms | avg 0.00 ms | max 0.12 ms-----------------------------------------------------------------------------------------------Indexed paths in `~/.config/fish`: 1 path [1] | `$__fish_config_dir` | 828 files-----------------------------------------------------------------------------------------------
The --time-only flag can be used as an alias to essentially behave like --time-startup --no-warning, and will produce a more concise output:
For user's who are experiencing issues with successfully configuring their editor to connect to the server, the startup verification commands above are likely the most straightforward way to confirm that the server is functioning correctly.
Typically, this indicates that a language client configuration issue is the probable cause of initial installation issues, rather than a problem with the server itself.
Checking Server Health
The server comes equipped with a built-in health check, which verifies that the minimum requirements for the server runtime are met, and also checks for out of date fish-lsp manpages + completions.
❯
fish-lsp info --check-health
show outputhide output▾
fish-lsp health check=====================checking `fish-lsp` command:✓ fish-lsp version: v1.1.4✓ fish-lsp binary found: ~/.yarn/bin/fish-lspchecking dependencies:✓ fish shell: v4.7.1-224-gf5af5564a✓ tree-sitter initialized successfully✓ node version satisfies minimum version '>=20.0.0' (current version: 22.14.0)fish_lsp_all_indexed_paths:✓ fish-lsp workspace '~/.config/fish' is a directory✓ fish-lsp workspace '~/.config/fish' is readable✓ fish-lsp workspace '~/.config/fish' is writablechecking log file:✓ log file found: /tmp/fish-lsp.log✓ log directory is writable: /tmpchecking completions:✓ completions file found: ~/.config/fish/completions/fish-lsp.fish✓ completions file is up to datechecking man page:✓ global man file found: ~/.local/share/man/man1/fish-lsp.1✓ binary man file found: ~/.local/share/man/man1/fish-lsp.1✓ global man file is up to datememory usage: rss: 85 MB heap Used: 17 MB heap Total: 34 MBsystem information: platform: linux node.js: v22.14.0 architecture: x64all checks completed!
Logging
Logging is disabled by default. Enable it by pointing
fish_lsp_log_file at a writable path, then tail it while a server is running:
set -gx fish_lsp_log_file /tmp/fish_lsp.logset -gx fish_lsp_log_level debug # debug | info | warning | error | logtail -f (fish-lsp info --log-file)# now reproduce the issue from your editor
Server Connects But Nothing Works
Confirm your client passes start as the argument and targets fish files:
fish-lsp info --dump-semantic-tokens /tmp/example.fish
show outputhide output▾
0:0 keyword len=8 "function"0:9 function len=5 [local] "greet"0:32 variable len=4 [local] "name"1:4 function len=3 [defaultLibrary] "set"1:11 variable len=8 [local] "greeting"2:4 function len=4 [defaultLibrary] "echo"2:11 variable len=8 [local] "greeting"2:22 variable len=4 [local] "name"3:0 keyword len=3 "end"5:0 function len=5 [local] "greet"
Add --no-color to any of the three --dump-* flags to strip ANSI colors,
e.g. when piping the output somewhere else.
You could also pipe valid fish shell as stdin to any of the above --dump-* commands.
❯
cat /tmp/example.fish | fish-lsp info --dump-parse-tree -
Source Maps
To debug the bundled server code with readable stack traces:
set -gx NODE_OPTIONS '--enable-source-maps --inspect'$EDITOR ~/.config/fish/config.fish
Note
Source maps might not be included in the build you are using (decided by the package manager or installation method used)
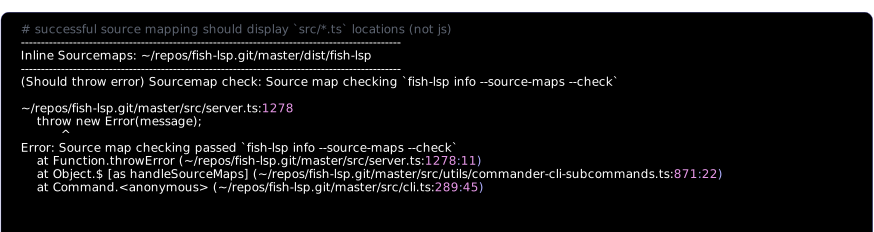
You can confirm if source maps are included by checking the output of:
❯
fish-lsp info --source-maps --check
If you are seeing bundled js locations in the stack traces, then try testing with a build that includes source maps instead (i.e., building from source with yarn build:bin or yarn build:npm, or downloading a standalone release)